New Security and Firewall Sections in Reports: Clear Data for Client Communications
Spending hours maintaining client sites?
WP Remote will streamline your WordPress maintenance process and save you at least 4 hours every week.
Have your clients complained of having to squint at their screens, trying to make sense of overcrowded security reports? If so, this new rollout is about to make your day, and theirs as well. Navigating the complexities of website security just got a leap easier with WP Remote’s latest update, specially tailored for those at the helm of managing multiple sites.
Spotlight critical security insights
As a WordPress expert, your eye is trained to spot the insights in data. That is not the case with your customers. When security works as it should, it is invisible to everyone except the experts.
We’ve refactored the security section of reports to shine a spotlight on how their site security is protecting them, their users, their data, and their revenue.
Site security is a critical component of care plans, and thus its value should be visible and prominent.
Improved data layouts
We have separated the Security and Firewall sections in reports. Now, you can provide a lot more powerful data to your clients, with the familiar granular control that you have come to expect of us.
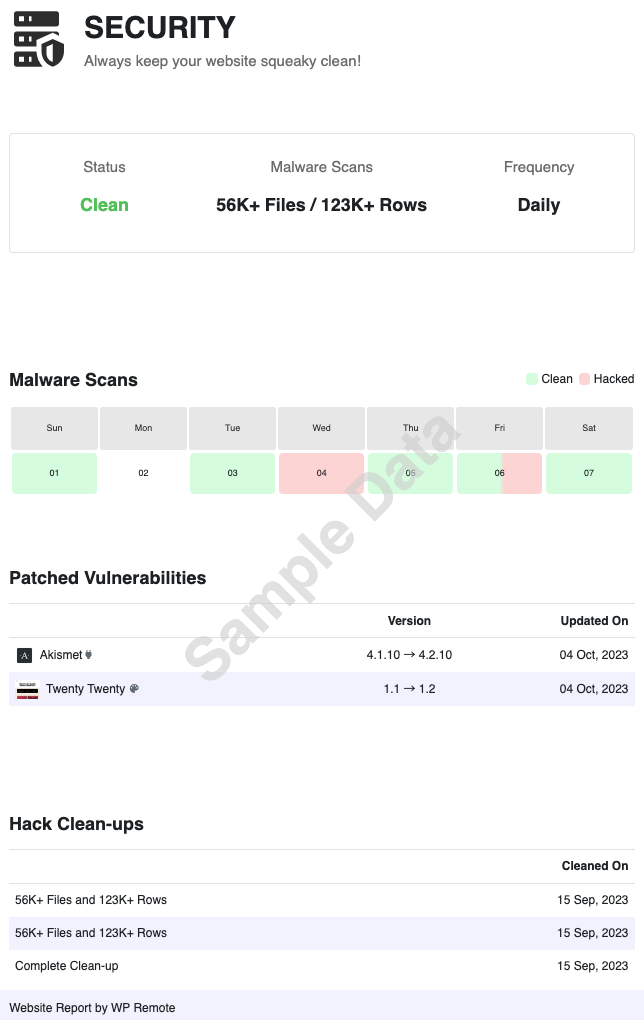
Security section
- Overview of Security: Displays the current status of the site (hacked or clean), the number of files and rows scanned in malware scans, and the frequency of these scans. This overview is like a health report for the site, and paints a clear picture of the effort involved in securing a site.
- Malware Scans Table: Shows data for the last 32 days or the entire report period, whichever is lesser, with days color-coded (red for hacked, green for clean, green and red for mixed status).
- Vulnerable Plugins/Themes Table: Lists plugins/themes that were patched due to vulnerabilities within the reporting period. Vulnerabilities are the biggest cause of hacks on sites, and updating vulnerable plugins promptly is a critical preventive activity.
- Hack Clean-Up Table: Details the number of hack cleanups performed, including the number of files and rows cleaned, along with the date of each cleanup.
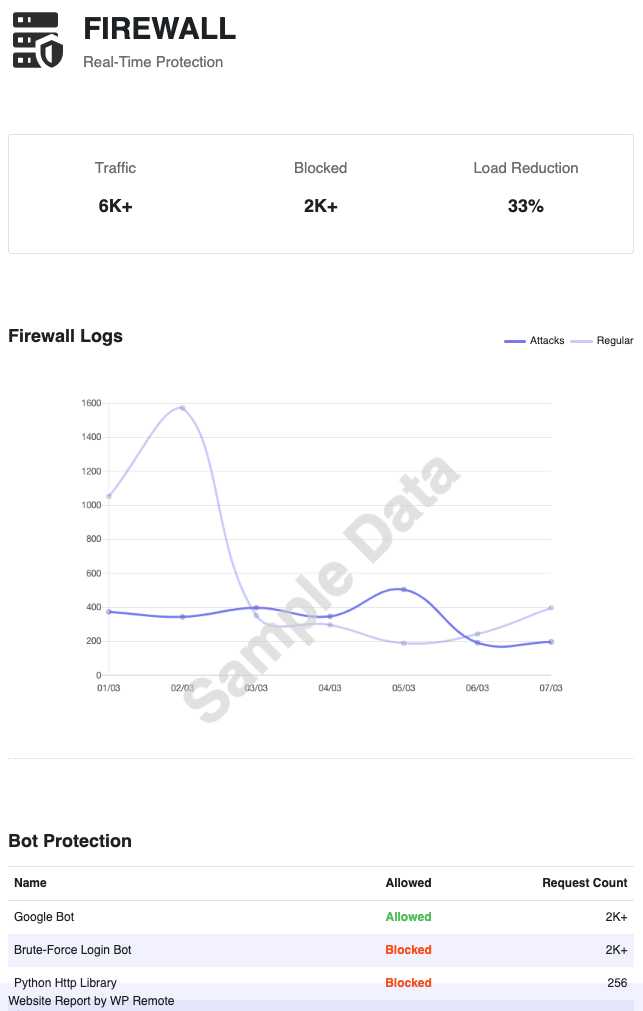
Firewall section
- Overview of Firewall: Provides statistics on the total number of requests received, the number of requests blocked, and the percentage reduction in server load due to blocked requests. Customers get a visual report on the efficacy of site security.
- Requests Graph: Features a two-line graph displaying the volume of overall requests versus attack requests during the reporting period. Any of the blocked requests could have resulted in a hack.
- Bot Protection Table: Displays the top 5 blocked bots, determined by request count, supplemented by top good bots if fewer than 5 bad bots are identified. The table is sorted overall. Effective bot protection prevents brute force attacks, as well as scrapers, while letting search indexing bots through.
Present clean and clear data to your clients
By separating Security and Firewall data, it instantly declutters the report. No more diving through mountains of data to find what your clients need. Now they can jump directly to the specifics, whether it’s for a quick check or a deep dive.
Keep your clients better informed
Each section now carries additional tables and graphs. From the frequency of malware scans highlighted in the Malware Scans Table to the intricacies of bot traffic in the Bot Protection Table, these tools offer your clients a granular look at their sites’ health. Identifying vulnerable plugins or themes? It’s now just a glance away.
Tell stories with data
Data isn’t just about numbers; it’s about stories. The color-coded Malware Scans Table and Requests Graph transform your report into a visually intuitive narrative. At a glance, your clients can grasp the state of their sites, where they thrive, and where they need support.
Help your clients make accurate decisions
More data and improved presentation lead to insightful conclusions. Aid your clients’ understanding of the effectiveness of your firewall, or how a cleanup operation improved their site’s health. This precision elevates your strategy from reactive to proactive, ensuring your sites, and clients, stay a step ahead in security.
Why this matters
This update isn’t just about a better-looking report; it’s about empowering agencies. It’s about offering peace of mind to you and your clients through transparency and detailed insights. Now, presenting your security efforts to clients becomes an opportunity to reinforce trust and demonstrate value. Reports are one of the biggest ways of showing that and how you are continuously protecting your clients’ websites; so we are improving that.
The rollout ensures that adjusting to these enhancements is seamless. Whether you’re creating new reports or navigating existing ones, adapting to the improved format is hassle-free. For agencies, this means no interruptions to your workflow, ensuring your focus remains on securing and elevating your client’s sites.
Tags:
Share it:
You may also like
A Little to the Left: What Would You Do if Your Site Design is Microscopically Different?
We spend a lot of energy getting site design right. And with good reason! Because gone are the days where a bad-looking site with good content (and great intentions) will…
WP Remote’s Revamped Auto-Update Feature and Notifications
Managing updates on WordPress sites has always been crucial. Each plugin, theme, or core update requires attention to ensure compatibility and security. However, it’s traditionally been quite a task for…

Simplified Email Reporting: Essential Metrics, Straight to Your Inbox
Introduction At WP Remote, we understand the importance of effective communication between agencies and their clients. Keeping clients informed about the work performed on their websites is crucial for building…
How do you manage your websites?
Managing multiple WordPress websites can be time consuming and error-prone. WP Remote will save you hours every day while providing you complete peace of mind.

Managing everything yourself
But it’s too time-consuming, complicated and stops you from achieving your full potential. You don’t want to put your clients’ sites at risk with inefficient management.

Putting together multiple tools
But these tools don’t work together seamlessly and end up costing you a lot more time and money.

